• REPORTS & DASHBOARDS

Data that drives
better decisions.

Build visual dashboards across jobs, invoicing, assets, engineers, and customers. Share the views that matter to each part of your team without giving everyone access to everything.

  • iOS & Android App
  • Works offline
cursor
One Dashboard

Custom dashboards for jobs, revenue, engineer performance, and compliance set as your homepage.

cursor
Your Metrics

Build reports on the metrics that matter to your business, not a fixed set someone else decided.

cursor
Job Profitability

Financial view reports break down every job's cost so you can see exactly where margins are made or lost.

cursor
Role-Based Access

Dashboards can be kept private, shared company-wide, or set as the homepage for specific user types.

WHAT’S INCLUDED

Build, Share & Export

Data you can act on, not just data you can look at. 

Customisable Dashboards

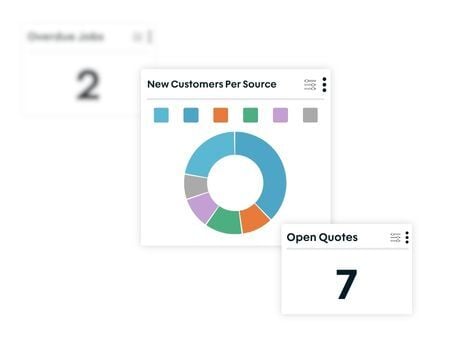
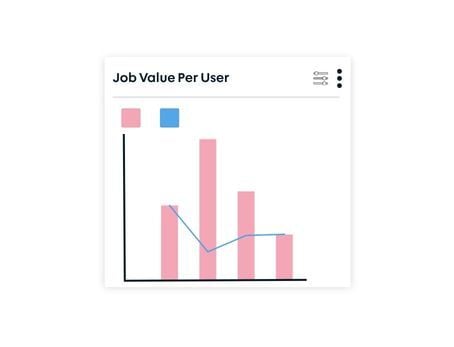
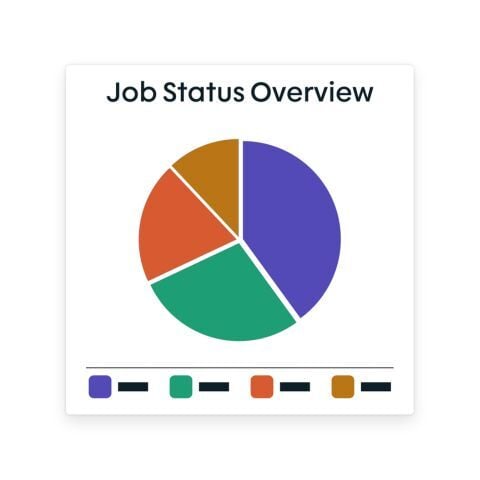
Build dashboards from bar charts, line charts, pie charts, and tabulated reports across any data in Fieldmotion, configured for whoever needs it.

  • ico
    Build dashboards with any data combination
  • ico
    Set any dashboard as a user's homepage
  • ico
    Share company-wide or keep private per role
customisable dashboards

Job, Asset, and Customer Reports

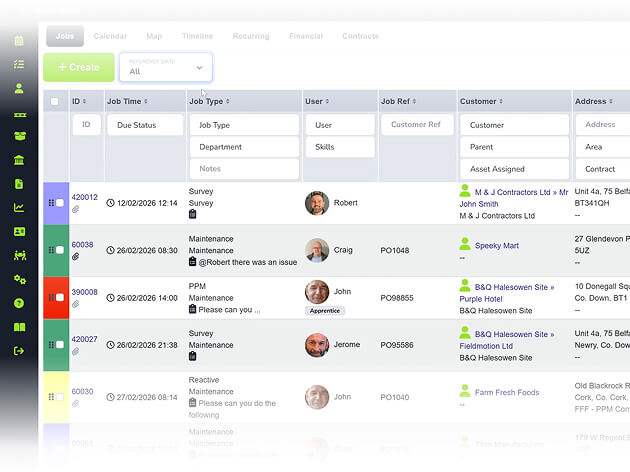
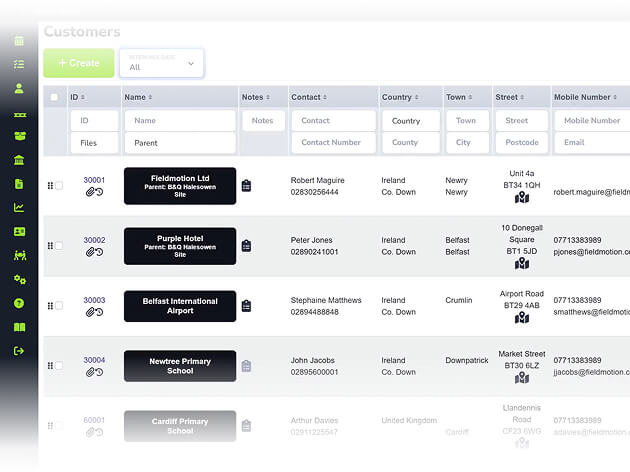
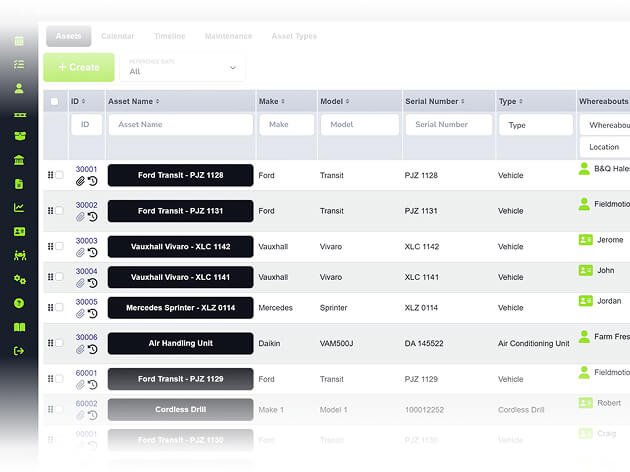
Report on anything logged in Fieldmotion: job completion rates, first-time fix, asset service histories, customer revenue, quote win rates. Export to CSV for external analysis.

  • ico
    Reports on jobs, quotes, assets, and invoicing
  • ico
    Filter by engineer, customer, or job type
  • ico
    Export any report to CSV
job asset and customer reports

Financial View and Job Costing

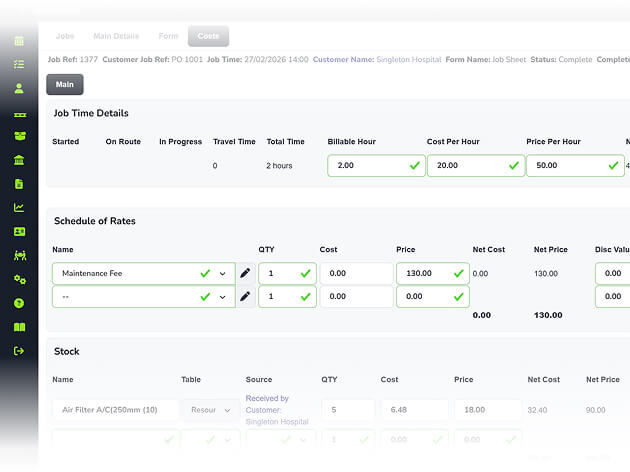
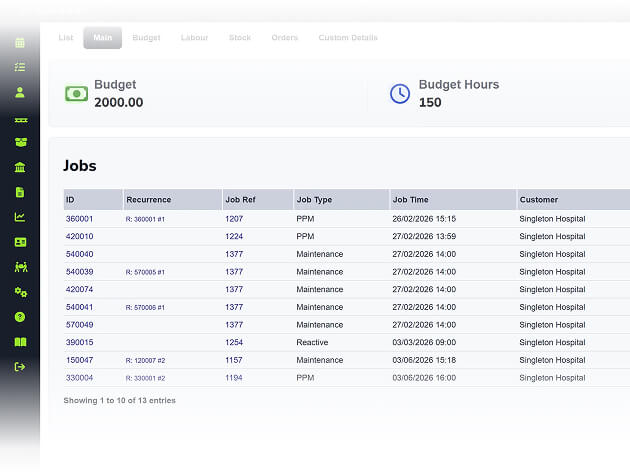
The financial view gives managers a full cost breakdown per job (labour, stock, mileage, and miscellaneous expenses) alongside the invoiced value, so profitability is visible at line level.

  • ico
    Compare budgeted vs actual costs per job
  • ico
    Identify your most profitable work
  • ico
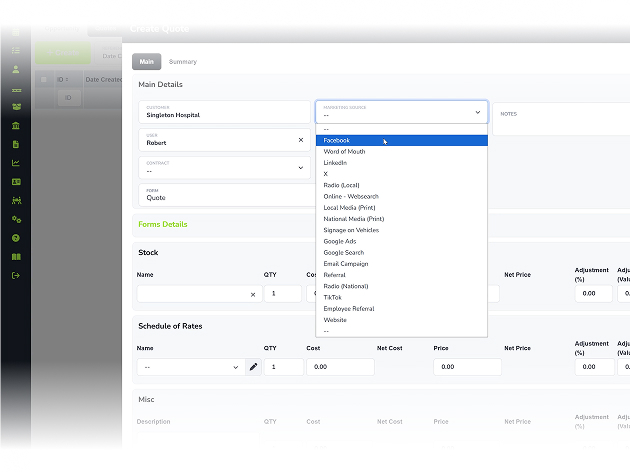
    Track lead sources, conversion rates, revenue
financial view and job costing
Group 1

THE PROCESS

How It Works

  • Choose your data source (jobs, invoices, assets, customers, or engineers) and select your report type.
  • Apply filters, set the date range, and configure your visualisation.
  • Save to a dashboard and share with the right people, or export to CSV for external use.

ROI SNAPSHOT

Quick Estimate of the impact on your Business

Fill in the fields below and generate your custom estimate.

Phone calls, back-and-forth, manual updates

Your Estimated ROI

Based on 230 working days

Fill in your numbers to see where time and money are slipping away.

SOFTWARE INTEGRATIONS

Works with all the tools you already use

  • xero
    Syncs with customers, invoices, and payments
  • quickbooks
    Syncs with customers, invoices, and payments
  • sage
    Syncs with customers, invoices, and payments

CLIENT RESULTS

Our Customers See Real Impact

"Fieldmotion has given the business comfort that there is a software solution available to us, and a support structure in place behind it that epitomises great customer service."
autor
Kevin Gray

Operations Director, Just Energy Solutions

  • 0%

    admin reduction

  • 0x

    faster invoicing

  • +0%

    on-time arrival

FAQs

What types of visualisation are available in Fieldmotion dashboards?

Fieldmotion dashboards support bar charts, line charts, pie charts, and tabulated data views. Each dashboard can be configured with multiple widgets showing different metrics (revenue trends, job completion rates, outstanding invoice values, engineer utilisation) and each widget can use a different visualisation type based on what makes the data clearest

Can different team members see different dashboards?

Yes. Dashboards can be set as the homepage for specific user roles, kept private to individual users, or shared company-wide. A field service manager might see engineer productivity and job completion data on their homepage, while a director sees revenue and margin reports. Both draw on the same underlying Fieldmotion data.

Can report data be exported for use outside Fieldmotion?

Yes. All report data can be exported to CSV, which opens in Excel, imports into accounting software, or feeds external analytics tools. This suits monthly management reporting, client reporting, or sharing data with your accountant without giving them direct access to Fieldmotion.

Does Fieldmotion provide job-level profitability reporting?

Yes. The financial view shows a detailed cost breakdown per job (labour hours and cost, stock used and value, mileage, and any additional expenses) alongside the invoiced amount. Managers can see margin at job level, identify where costs are running over, and compare performance across job types, customers, or engineers.